
Figure 3. Correlation between BOLD Activity and Behavioral Performance for the Three Regions of Interest—RC, LO and PP—in the Trained and Untrained Conditions.
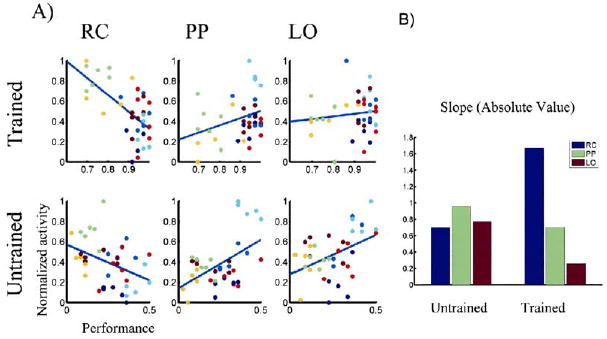
(A) For the regions where we had predicted a change, RC, LO, and PP, (Gilbert et al., 2001) we studied the correlation between BOLD activity and behavioral performance. This analysis was based on the voxel that elicited the biggest difference between the Trained and Untrained conditions within the nearest cluster from previously defined anatomical coordinates (Grill-Spector et al., 1999; Lerner et al., 2001). At each voxel, we calculated the level of BOLD activity for each session and for each condition (37 total) and correlated this with the behavioral performance. For the Trained condition, performance varied within the 60%–100% range, and for the Untrained condition, within the 0%–50% range. The graphs on the left show RC activations (Talairach coordinates [20,−102,−4]), the middle graphs show PP activations (Talairach coordinates [32, −70, 42]) and the graphs on the right show LO activation (Talairach coordinates [−46, −72, 4]). The top row corresponds to the Trained condition and the second row, to the Untrained condition. RC activation is negatively correlated with behavioral performance, and the correlation becomes significantly stronger in the Trained condition. LO and PP are positively correlated, and this correlation becomes substantially weaker in the Trained condition.
(B) To measure how “informative” different regions are about subjects’ performance, we calculated the absolute value of the slope at each voxel. After training, the RC becomes significantly more correlated with; and the LO becomes decorrelated from; performance. Blue bars indicate the RC, green bars indicate the PP, and red bars indicate the LO.