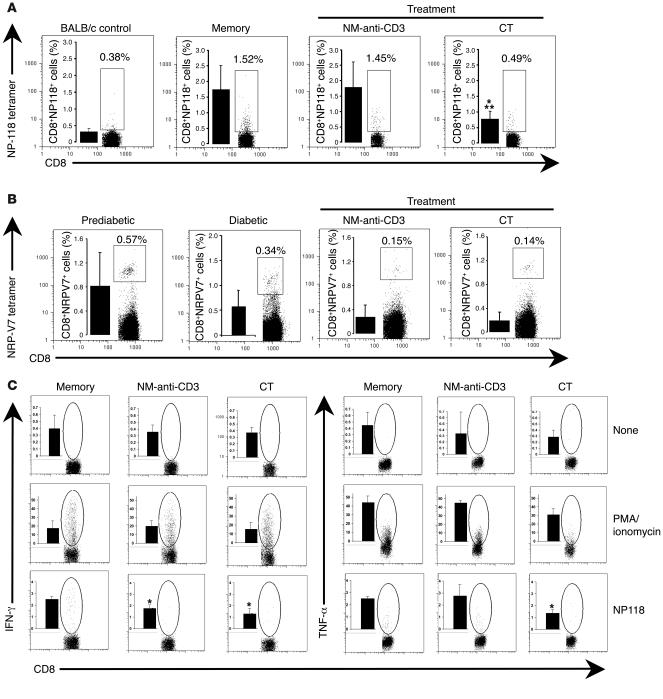
Figure 5. Reduced autoaggressive CD8+ T cell responses after combination treatment.
(A) The percentage of NP118 tetramer–positive CD8+ T cells in nondiabetic LCMV-infected RIP-NP mice (5 weeks after infection) or after treatment (anti-CD3 alone or combination therapy). Numbers above the gated cells correspond to the percentage of tetramer-positive CD8+ T cells found in the individual mice represented in the figure. Histograms, shown as insets, represent the average of n = 6–9 mice per group. As control, BALB/c mice were used. *P = 0.0036 compared with mice that have been infected but are in the memory phase of viral clearance (memory mice) and **P = 0.0057 compared with mice treated with NM-anti-CD3 alone. (B) The percentage of NRP-V7 tetramer–positive CD8+ T cells is shown for prediabetic NOD mice (10-week-old mice), for diabetic NOD mice, and for cured NOD mice after treatment (anti-CD3 alone or combination therapy). Numbers in the upper-right corner correspond to the percentage of tetramer-positive CD8+ T cells found in the individual mice shown in the figure. Histograms, shown as insets, represent the average of n = 5 mice per group. (C) The percentage of IFN-γ– and TNF-α–expressing CD8+ T cells was measured by intracellular staining in nondiabetic LCMV-infected RIP-NP mice, either nontreated (memory) or treated (anti-CD3 or combination therapy). Rows correspond to 3 different in vitro stimulations. Splenocytes and PLN cells were pooled and stimulated with either PMA/ionomycin or NP118 peptide or remained unstimulated (None). Histograms, shown as insets, correspond to the mean ± SD of IFN-γ– or TNF-α–positive CD8+ T cells (n = 3–5 mice per group). *P < 0.05 compared with the LCMV memory control.

