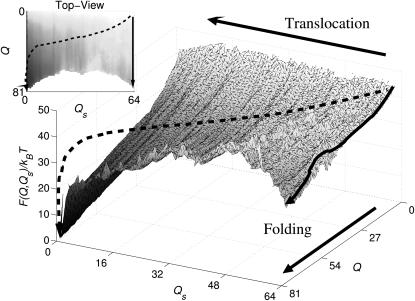
FIGURE 4.
Plots of the free-energy landscape  as a function of the number of native contacts Q and of the number of residues inside the cage Qs, computed at T = TF/2, where TF is the temperature at which there is equilibrium between the unfolded and the native states. The states with the lowest free energy correspond to conformation of the chain folded outside the cage (Qs = 0 and Q = 81), demonstrating a preference for the extrusion-plus-folding process. The arrows represent trajectories for the folding-plus-translocation (dashed arrow) and for the intracage folding (solid arrows). Although both translocation and intracage refolding are possible, the first scenario leads to a greater reduction in free energy. The cage is covered with the most repulsive amino acid, Arg, with an average repulsive strength per contact of 0.38. The nonsampled region corresponds to conformations of the chain too compact to exist across the hole.

