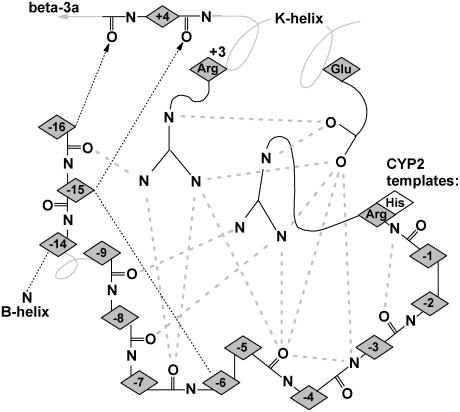
FIGURE 5.
Schematic view of the hydrogen bonding network in the ERR-triad. Shaded dashed lines indicate conserved hydrogen bonds between the triad residues and the surrounding backbone. Numbering in the K-helix is relative to the conserved glutamate, and numbering in the structure surrounding the triad is relative to the conserved arginine (histidine in CYP2 templates) near the start of the meander region. The thin dashed lines indicate additional side-chain interactions that stabilize the loop/helix structure at the end of the β-3b strand and the link to the B-helix.

