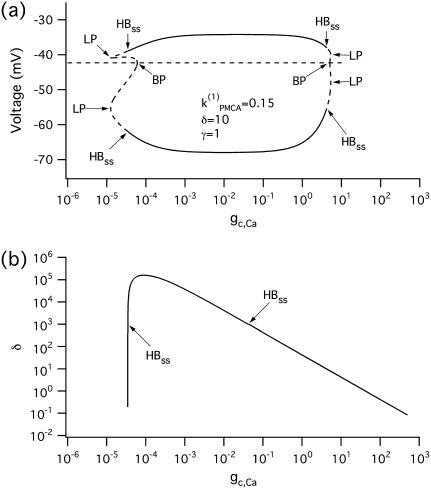
FIGURE 4.
Bifurcation diagrams of the Morris-Lecar β-cell model in the case of identical cells, with parameter values taken from the region of bistability  (a) Bifurcation diagram in the case of two identical cells, showing the nonhomogeneous steady-state solutions as a function of gc, Ca. (b) Locus of the pair of Hopf bifurcation points, HBss in the two-parameter (gc, Ca, δ)-space. (HB, Hopf bifurcation; BP, symmetry-breaking (pitchfork) point; LP, saddle node.) The broken lines denote instability.

