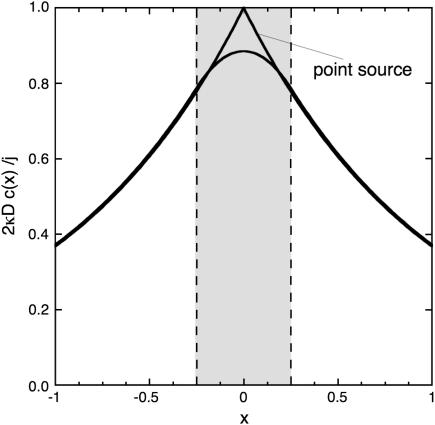
FIGURE 11.
The one-dimensional steady-state profiles obtained in Eqs. 11 and 14 are compared. The shaded interval represents the spatial extent of the cluster. The point-exact solution is relatively flat inside the cluster, whereas the point-source solution exhibits a sharp peak at the point source.

