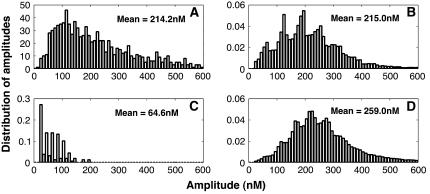
FIGURE 6.
Amplitude distribution of puffs with various diffusion coefficients and IP3 concentrations. (A) Experimental data. The vertical axis represents the number of events obtained for corresponding amplitudes. (B) D = 30.0 μm2 s−1. (C) D = 100.0 μm2 s−1. (D) IP3 = 10 μM, D = 30 μm2 s−1. (B–D) Vcluster = 800.0 s−1. The experimental data have been estimated by eye from Fig. 3 of Thomas et al. (6).

