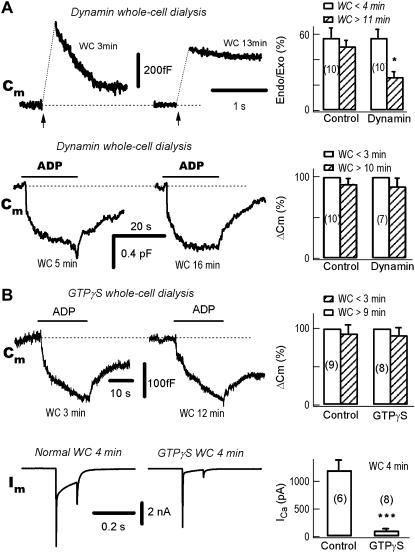
FIGURE 4.
The ADP-induced endocytosis is dynamin-independent. (A) ADP-induced endocytosis is independent of dynamin-1. In the same neuron, the left panels show a typical experiment during whole-cell (WC) dialysis of the mutant dynamin-1 dynPRD (250 μg/ml). The neuron was stimulated either by depolarizing pulses (upper traces) or ADP puffs (lower traces) at the times indicated. The exocytosis-coupled endocytosis was substantially blocked at 13 vs. 3 min. (Upper right) Statistically, the pulse-induced endocytosis/exocytosis (Endo/Exo) ratio was significantly decreased from 57 ± 8% to 27 ± 5% at <4 vs. >11 min (p <0.01, n = 10). In contrast to the exocytosis-coupled endocytosis, ADP-induced endocytosis was independent of the whole-cell dialysis of dynPRD at 5 vs. 16 min (lower traces). On average, ADP-induced endocytosis were −93 ± 10 fF and −115 ± 14 fF, after break-in for <4 vs. >11 min, respectively (n = 10). (B) ADP-induced endocytosis is independent of GTP. (Upper left) During whole-cell dialysis of 2 mM GTPγS the ADP-induced endocytosis was intact, as compared at 3 vs. 12 min. (Upper right) Statistically, ADP-induced endocytosis were −97 ± 12 fF and −94 ± 11 fF at <3 min and >9 min, respectively (n = 8). (Lower left) Whole-cell dialysis of GTPγS blocked depolarization (Vm from −80 to 0 mV for 100 ms)-induced Ca2+ currents (Im). Comparing the control neuron with Ca2+ currents induced by a 100-ms pulse from −80 to 0 mV, the Ca2+ current was blocked in another neuron by intracellular dialysis with GTPγS. The two neurons were from same batch. (Lower right) Four minutes after break-in, the Ca2+ currents were 1202 ± 180 pA and 110 ± 19 pA in control (n = 6) and GTPγS (n = 8) dialyzed neurons, respectively.

