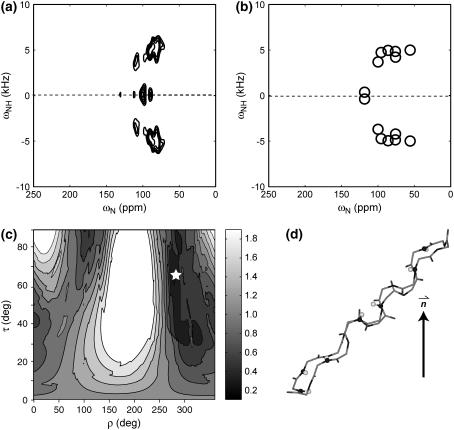
FIGURE 8.
(a) Experimental 2D 15N-1H/15N correlation spectrum of retrocyclin-2 in POPC bilayers (P/L = 1:25). The peak shift to lower chemical shifts compared to the DLPC spectrum (Fig. 4 a) and the strong overlap both indicate a more in-plane orientation of the peptide. (b) Best-fit spectrum with τ = 65° and ρ = 278°. (c) RMSD between the experiment and simulations as a function of (τ, ρ). The minimum RMSD position is indicated by a star. (d) Orientation of retrocyclin-2 in POPC bilayers.

