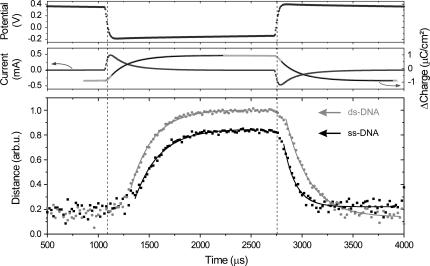
FIGURE 2.
Time-resolved measurements of the electrically induced, mechanical switching of a 48-mer oligonucleotide layer in electrolyte solution. The upper panels show the electrochemical response of the electrode measured for single-stranded samples (data are representative for double-stranded layers as well). Solid black lines are single exponential fits to the accumulated charge, yielding characteristic time constants of 194 ± 2 μs for both polarities. Relative information of the distance of the DNA's top end to the surface (bottom panel) is inferred from the measured fluorescence intensity. (Hybridizing Cy3-labeled ssDNA strands with strands of complementary sequence results in an enhancement of the dye emission by a factor 1.7. The fluorescence intensity emitted from dsDNA layers has been corrected by this factor before deconvolution to relative height.) Solid lines are single exponential fits to the data. The extracted time constants are listed in Table 1.

