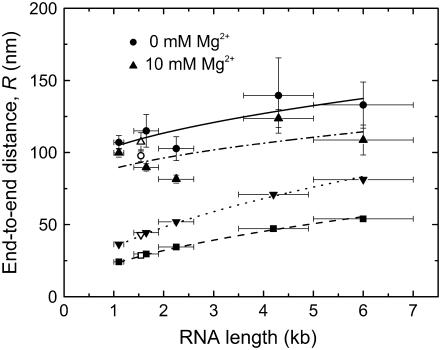
FIGURE 6.
RNA 5′-to-3′ end distance R as measured by TPM, plotted as a function of average RNA length in kilobases. Poly(U) size ranges are represented as closed circles (0 mM Mg2+) and closed triangles (10 mM Mg2+) and are fit with solid and dashed-dotted curves, respectively. The fitted curves represent the following function:  where R0 is the offset in the end-to-end distance of the polymer (R) due to the attached bead. R0 offsets for the curves described by the closed circles (0 mM Mg2+) and closed triangles (10 mM Mg2+) were found to be ∼75 nm. R-values calculated from persistence length (P) for a single-stranded RNA polymer and end-to-end distance for either an extended RNA chain (closed upside-down triangles) or a single-stranded helix (closed squares) are also plotted as a function of polymer length and fit with dotted and dashed curves, respectively, using the equation described above (except that R0 was set to zero). Open shapes represent experimental and predicted R-values for 16S rRNA.

