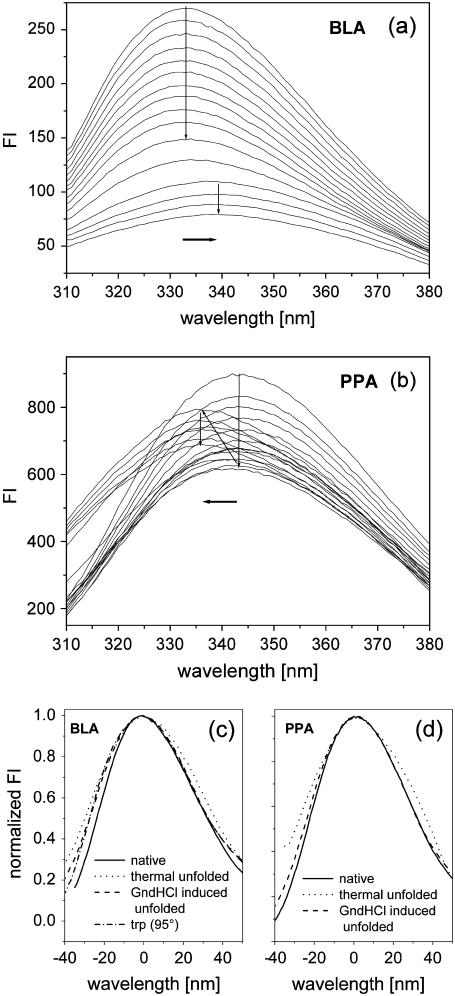
FIGURE 2.
(a, b): Fluorescence emission spectra obtained with an excitation wavelength of 280 nm during thermal unfolding. Both series of spectra were taken with a protein concentration of 50 μg/ml using a heating rate of 1°C/min for BLA between 65°–117°C and for PPA between 25°–78°C. (c, d): Presentations of spectral shapes for three different protein states and for a solution of pure L-tryptophan are shown here. The spectral shapes of emission spectra obtained with L-tryptophan at different temperatures (20 and 95°C, only the latter is shown in c) revealed no differences. To overlay the different spectra, original spectra were normalized and shifted from their respective emission maximum (see Table 2) to a joint reference point (zero).

