
Figure 7.
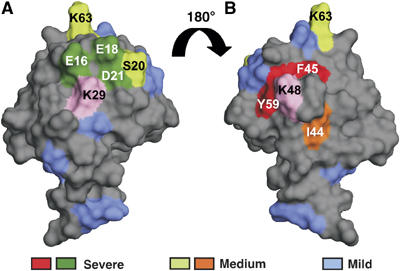
Locations of acceptor Ub mutations that affect linkage selection by KIAA10. Blue denotes mild mutations (effects on linkage selection were not determined); dark green denotes severe mutations that reduce use of K29; and light green (K63A, S20A) denotes medium mutations that affect use of K29. Red denotes severe mutations that reduce use of K48; orange (I44A), medium mutation that reduces use of K48. K29 and K48 are shown in pink. Panel B was obtained by rotating panel A 180°.