
Figure 2.
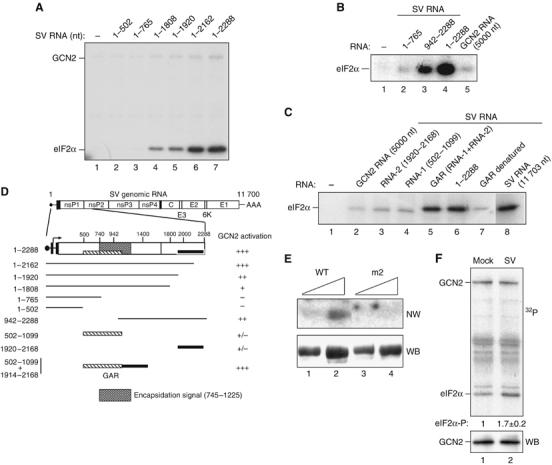
Activation of GCN2 by SV RNA involves two nonadjacent regions at the 5′-end of the viral RNA and the HisRS domain of GCN2. (A) The 5′-end-containing RNAs encompassing the indicated nucleotides of SV RNA were assayed for their ability to activate GCN2 as described in Figure 1. (B) Activation of GCN2 by the indicated fragments of viral RNA. GCN2 RNA was assayed as a negative control. (C) Fragments 1920–2168 (RNA-2) and 502–1099 (RNA-1) were tested alone or in combination, upon joining them by DNA recombinant technology (GAR construct; GCN2 Activating RNA). The heat-denaturated GAR fragment was also assayed, as well as native SV RNA 1–2288 and a full-length RNA (1–11 703). All RNAs were used at the same concentration (0.64 nM). In (B) and (C), only eIF2α phosphorylation is shown. (D) Schematic diagram depicting regions of SV genomic RNA involved in activation of GCN2 according to data from (A) to (C). GCN2 activation by the different RNA fragments is expressed as % of activity with respect to those obtained with full-length SV RNA: (+++), 75–100% activity, (++), 50–75% activity, (+), 25–50% activity and (+/−) less than 25% activity. Data are expressed as the mean of at least three independent experiments. GAR (hatched and black boxes) and the encapsidation signal in the SV genome (shadow box) are also drawn. (E) GCN2-(WT) and the HisRS mutant GCN2-m2 were purified as described in Materials and methods. Two different amounts of proteins were resolved in a 7.5% SDS–PAGE, transferred to a nitrocellulose membrane and probed with a 32P-labeled GAR fragment in a Northwestern blot assay (NW, top panel). The amount of loaded protein was monitored by reprobing the membrane with anti-myc antibody (WB, bottom panel). (F) MEFs were mock-infected or infected with SV at an MOI=50, and cell lysates were prepared at 2 h.p.i. and subjected to immunoprecipitation with anti-GCN2 antibody. Immune complexes were assayed for their ability to phosphorylate eIF2α (top panel). The amount of GCN2 was monitored by immunoblot using anti-MGCN2 antibody (bottom panel). The amount of 32P incorporated in eIF2α was quantified in a Phosphorimager BAS-1500 (Fujifilm). A representative experiment out of three that yielded similar results is shown. Numbers under the top panel represent the increase in eIF2α phosphorylation in immune complexes from SV-infected cells compared to those from mock-infected ones. Values indicate the mean±s.d.