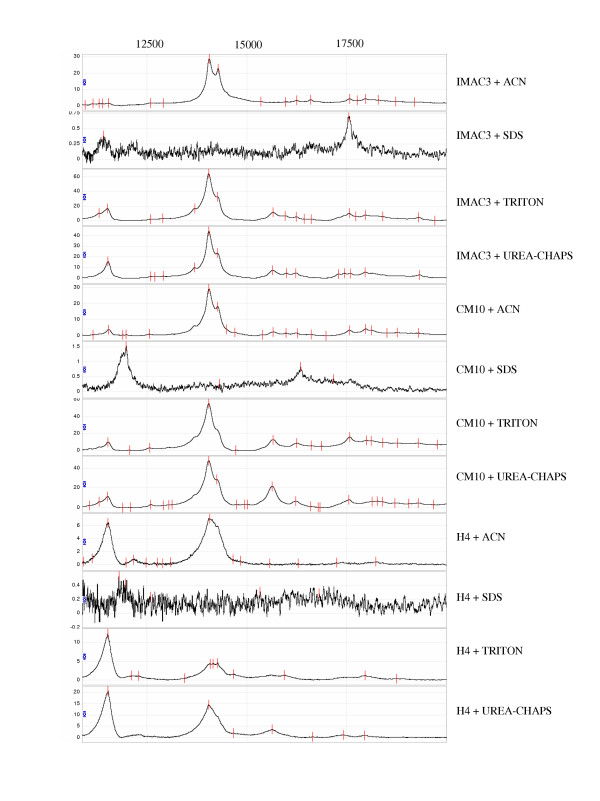
Figure 2.
Representative SELDI spectra of four solubilizing reagents and three types of array at the high laser energy (see text for details). The x-axis represents the M/Z ratio and the y-axis represents intensity of the peaks. Peaks (tick marks) were detected by Ciphergen's Biomarker Wizard software (Ciphergen Biosystems, Fremont, CA).

