Figure 3.

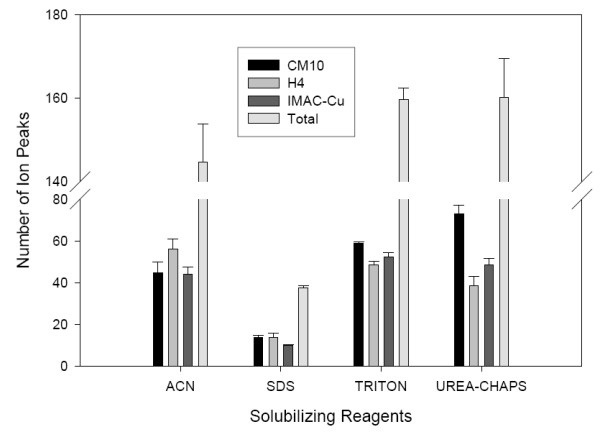
Number of peaks detected by SELDI experiments using various solubilizing reagents and array types. The y-axis values represent the mean values of the three replicates performed on different days.

Number of peaks detected by SELDI experiments using various solubilizing reagents and array types. The y-axis values represent the mean values of the three replicates performed on different days.