
Figure 3.
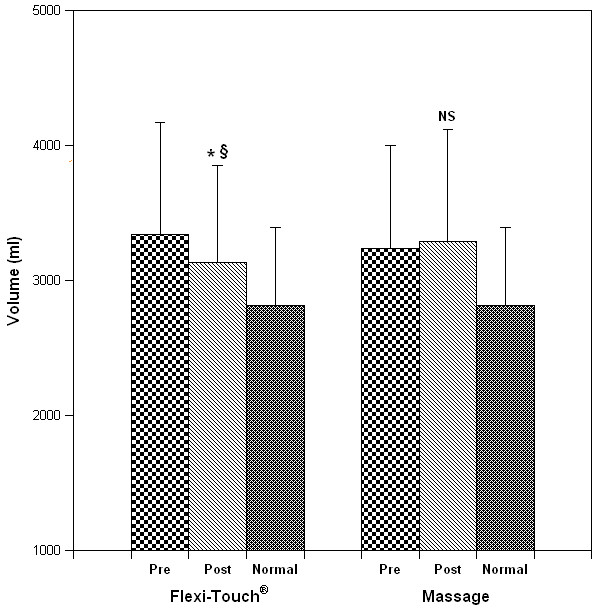
The effect of treatment modality on limb volume. Panels A and B depict the measured volume of the affected limb for each patient before and after Flexitouch™ and MLD therapy, respectively. Panel C illustrates the grouped data for each treatment phase (mean ± S.D.; * P = 0.002 when compared to pretreatment volume; § P = 0.007 when compared to the response to MLD). By multiple regression analysis, treatment status (Flexitouch™ versus massage) was predictive of volume change (P < 0.02). When controlled for the pre-treatment body weight, the results were unchanged; however, pretreatment arm volume was predictive of treatment response (P = 0.008).