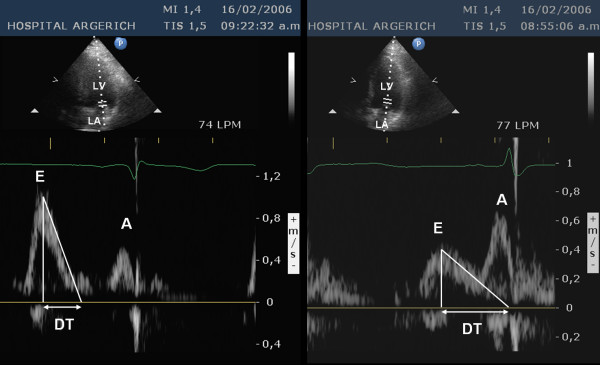
Figure 1.
Apical four-chamber view of the left ventricle and Doppler transmitral flow velocity. Left: normal pattern. Right: abnormal pattern of a patient with Chagas' disease. LV: left ventricle, LA: left atrium, E: peak early diastolic velocity, A: peak late diastolic velocity, DT: deceleration time of the early diastolic flow.

