Figure 3.

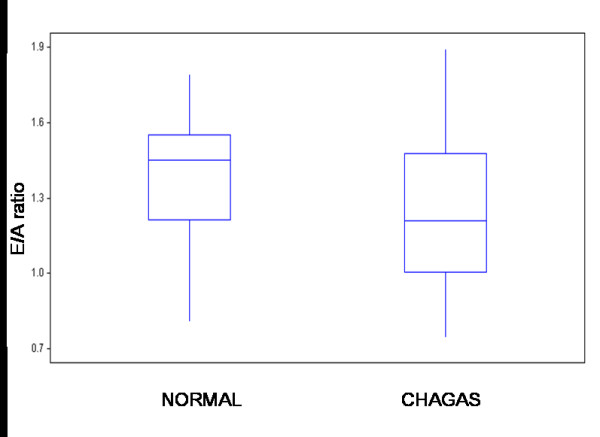
E/A ratio of the transmitral Doppler values in healthy subjects and patients with Chagas' disease. Box plot displaying median and interquartile range: solid circles indicate means.

E/A ratio of the transmitral Doppler values in healthy subjects and patients with Chagas' disease. Box plot displaying median and interquartile range: solid circles indicate means.