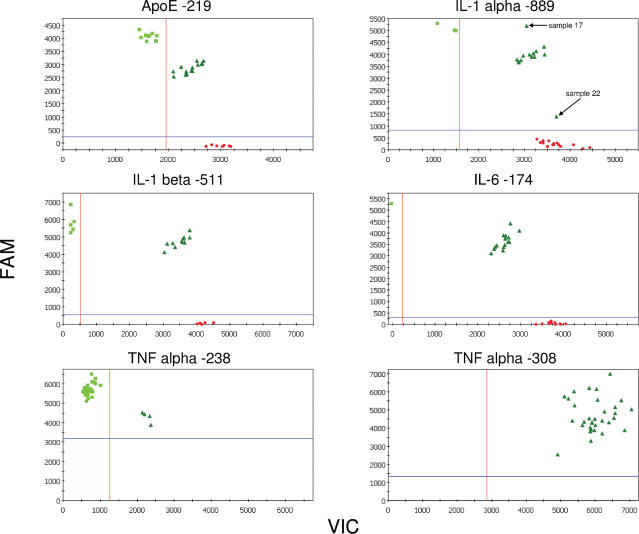
Figure 2.
Allelic discrimination plots of end-point fluorescent TaqMan PCR data of 6 SNPs analyzed in 32 healthy blood donors. VIC fluorophore (x-axis) is associated with the probe for allele A, while FAM (y-axis) labels the allele B probe. The plots were generated using iCycler IQ software (Bio-Rad, Hercules, CA). For IL-1 alpha −889, outlying samples 17 and 22 are marked.

