
Fig. 4.
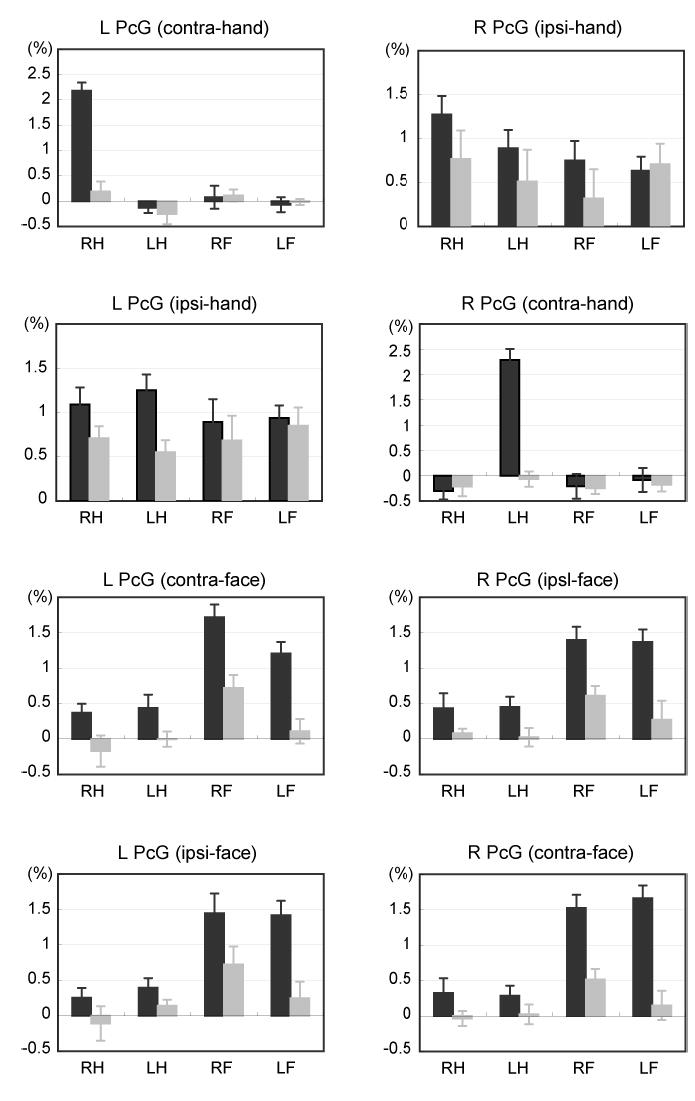
Somatotopy represented in the PcG zones during the auditory-cued movement (dark gray) and auditory-cued motor imagery (light gray). The contra- and ipsi-PcG zones (See Table 1 for the information) were determined for each effector in each individual. Task-related percent signal changes were averaged across subjects. Error bars represent standard errors of mean. RH, right hand; LH, left hand ; RF, right face; LF, left face