Figure 2.

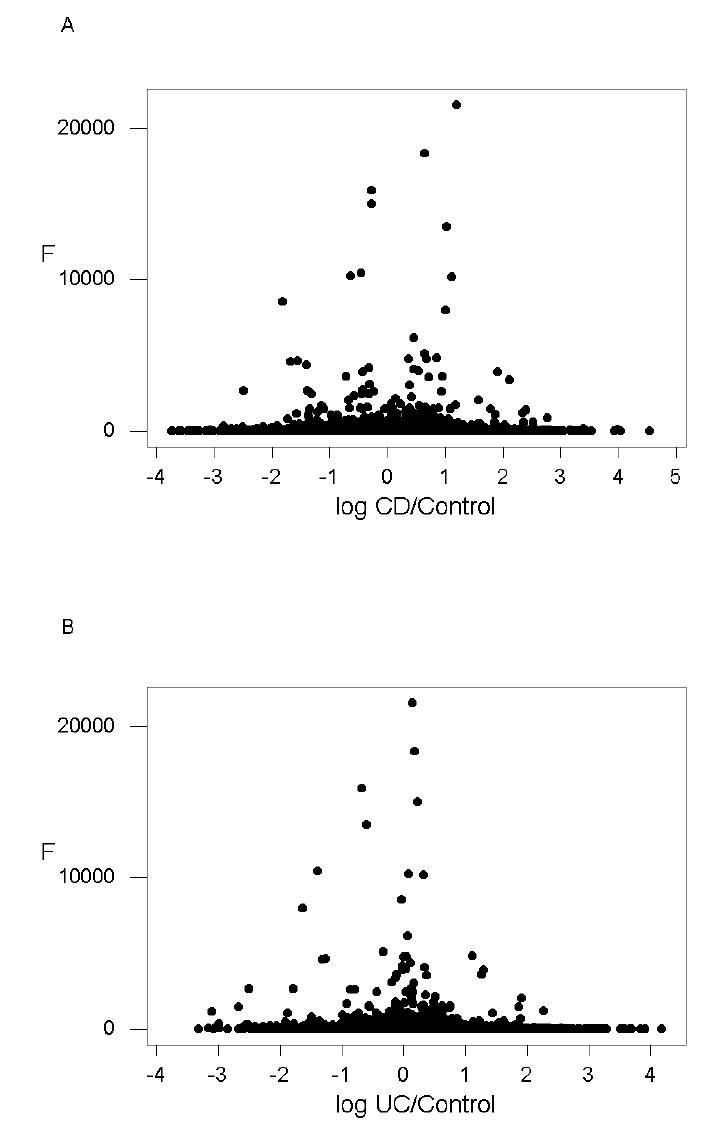
Plots of the F-statistic for the effect of disease state vs. the natural logarithm of the mean ratios (A) CD to control (r = 0.006; n.s.); and (B) UC to control. (r = −0.016; P = 0.001).

Plots of the F-statistic for the effect of disease state vs. the natural logarithm of the mean ratios (A) CD to control (r = 0.006; n.s.); and (B) UC to control. (r = −0.016; P = 0.001).