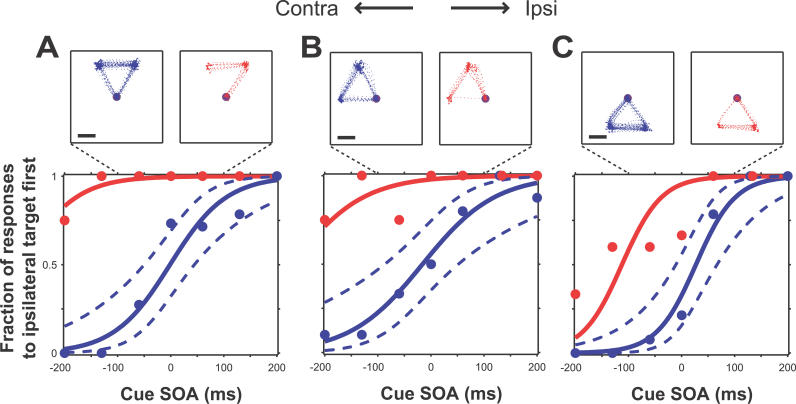
Figure 3. Effect of Stimulation at Three SEF Sites.
Psychometric behavioral curves are shown in the lower panels. Horizontal axis, SOA; vertical axis, fraction of trials where the first saccade was directed to the more ipsilateral target. Blue, unstimulated trials; red, stimulated trials. Solid lines, logistic regression curve. Dotted blue lines, simultaneous 95% confidence interval. Number of trials for each plot (stim/unstim): (A) 28/96; (B) 30/67; (C) 28/95. Upper panels: eye traces from every trial of the three central SOAs: 0, −60, and +60. Scale bar: 5°; fixation spots not drawn to scale. In each case stimulation strongly biased the animal to choose the more ipsilateral target first (and thus the more contralateral second).

