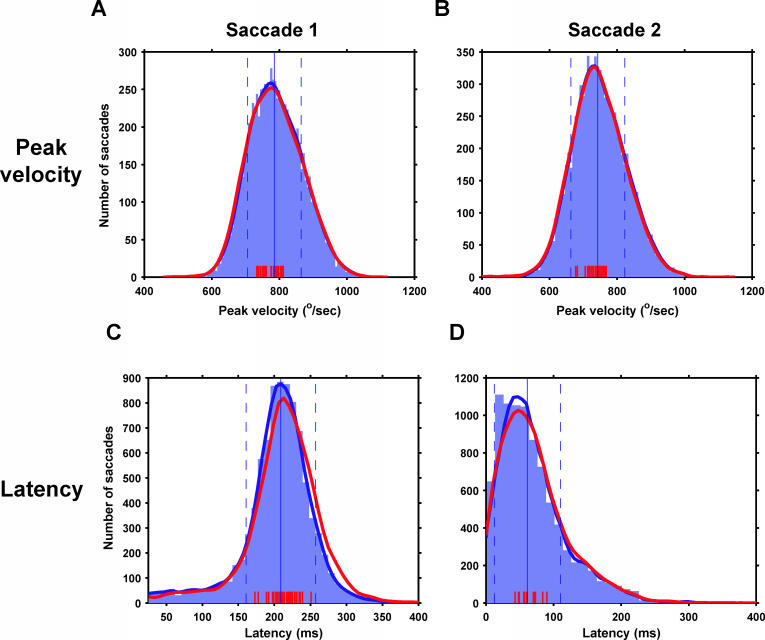
Figure 5. Velocities and Latencies Are Unchanged by Stimulation.
Peak velocities of first and second saccades, respectively (A and B). Blue region, histogram of peak saccade velocities on unstimulated trials. Thick blue lines (largely hidden by red lines), kernel density estimate of this distribution. Thick red lines, estimate of the distribution of stimulated peak velocities. (Histogram not shown.) Solid and dashed blue vertical lines, mean and s.d. of unstimulated distribution. Red tick marks (bottom), the mean peak velocity for stimulated trials for a single stimulation site. Note that all red tick marks lie within 1 s.d. of the mean of the unstimulated distribution. Latencies of first and second saccades (C and D) use the same conventions.

