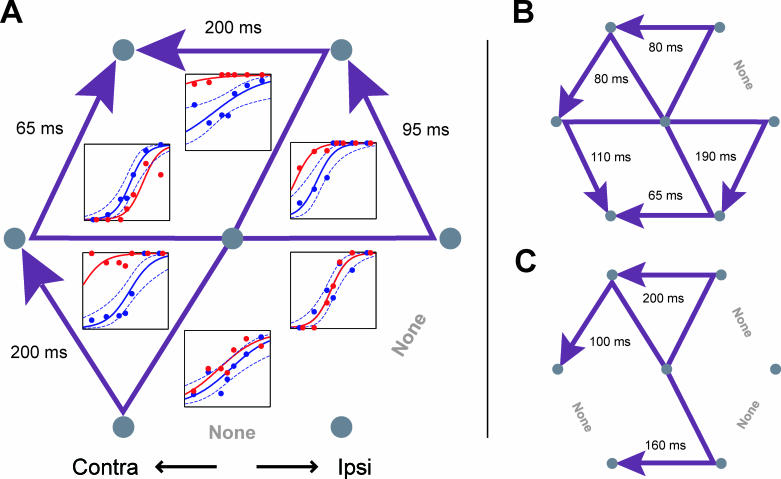
Figure 6. Stimulation Biases Endpoints toward a Contralateral Zone.
The pattern of stimulation-induced bias at all pair locations from three different SEF sites (A–C). Purple arrows, the sequence that was preferred on stimulation trials. Numbers outside each pair, magnitude of the shifts (milliseconds of SOA). Psychometric curves (conventions as in Figure 2) are shown for each pair in (A).

