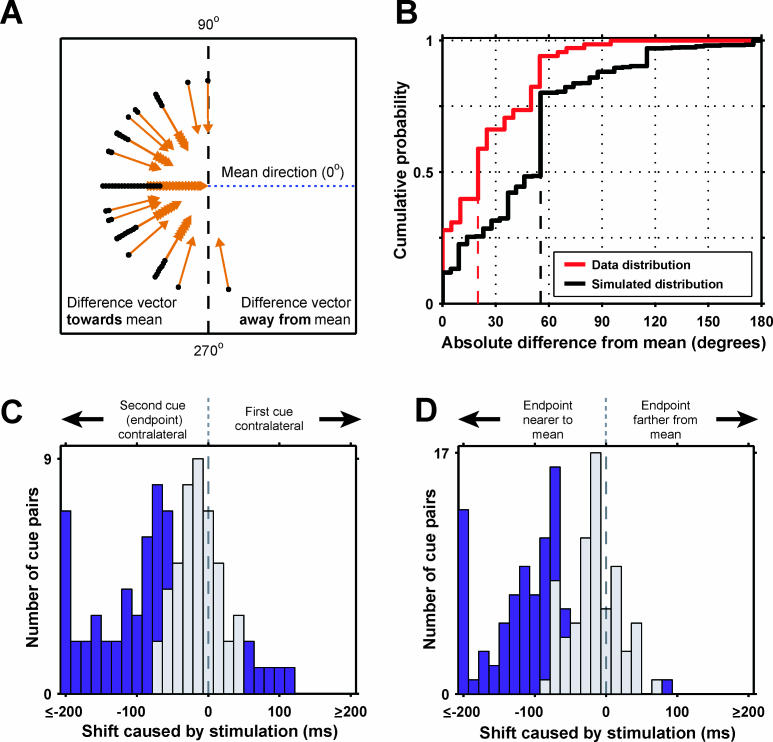
Figure 7. Bias Directions Are Convergent.
(A) Difference vectors around each site's mean vector. Black dots, origin of each difference vector; vectors are offset radially, so all are visible. Vector origins beyond the 90–270° vertical line (1/59; 23 expected by chance) indicate a shift direction away from the mean.
(B) Cumulative distribution of absolute differences between each vector and the site's mean (summary of the effect in [A]). Red line, true distribution; black line, simulated null distribution; dashed vertical lines, medians. The distributions are significantly different ( p < 10 −6; Kolmogorov-Smirnov statistic = 0.36).
(C and D) Magnitude of sequence effects. (C) Histogram of biases for pairs with one target ipsilateral and one contralateral to fixation. Horizontal axis, size of shift. Purple, statistically significant shifts ( p < 0.05); gray, non-significant shifts. Positive shifts signify that the contralateral target was chosen first, negative shifts that the contralateral target was chosen second. (D) Histogram of bias directions relative to difference vector mean direction, conventions as in (C).

