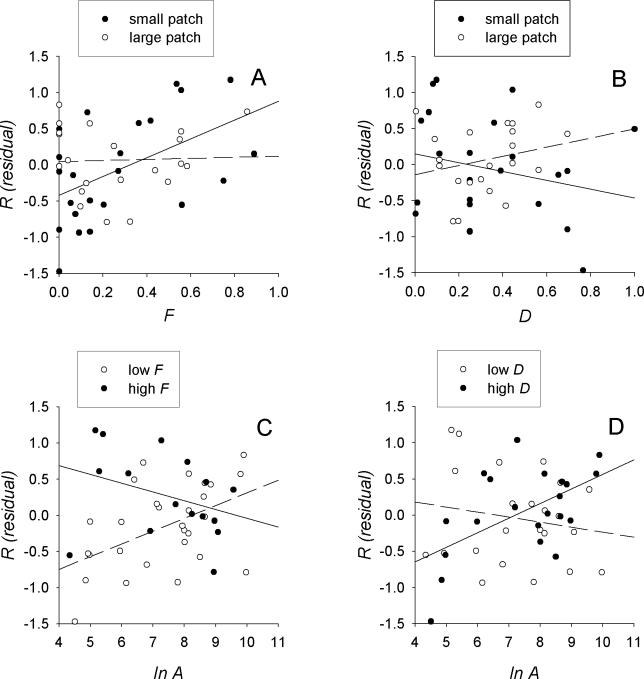
Figure 2. Population Growth Explained by Habitat Patch Area and Pgi Genotypes in Isolated Habitat Patches, in which Population Dynamics Are Little Influenced by Immigration .
The dependent variable in each panel is the residual growth rate ( R) from a regression of R against regional trend in population sizes ( N trend), which is explained by genotypic composition and habitat patch area in isolated patches ( S t < 15). (A and B) show R against the Pgi genotype frequencies F and D, respectively, in small ( A < 0.3 ha; closed symbols, continuous line) and large habitat patches (open symbols, broken line). (C) shows R against patch area in populations with F greater (closed symbols, continuous line) or smaller than 0.3 (open symbols, broken line), respectively, and (D) shows the same result for D. Statistics on F are given in Table 1. In (B and D), the interaction between D and ln A is significant ( p = 0.005; full model F 3,40 = 3.64, p < 0.02).

