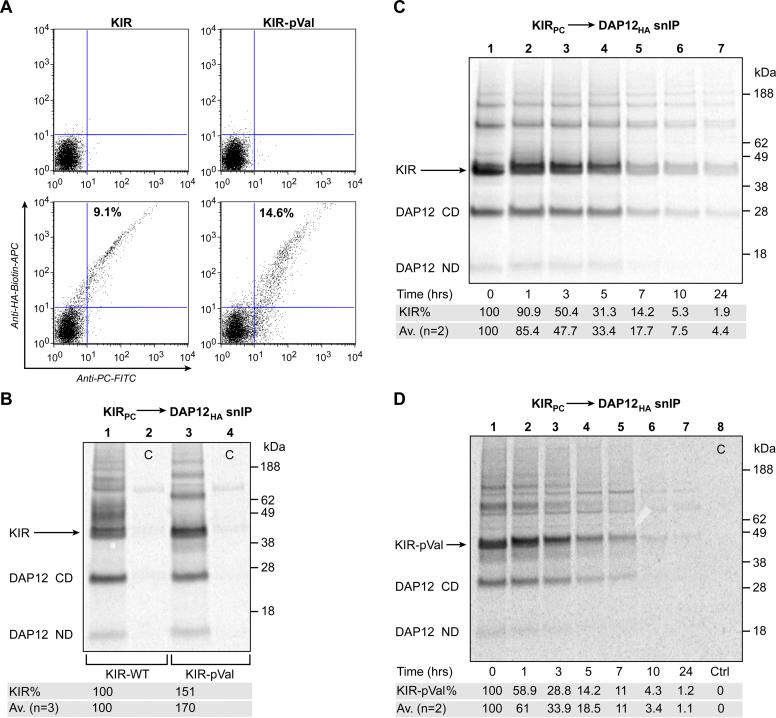
Figure 3. Surface Expression and Half-Life of the Complex between DAP12 and the KIR-pVal Mutant.
(A) Jurkat cells were transiently transfected with KIR and DAP12 constructs that encoded N-terminal epitope tags. Surface expression of KIR–DAP12 complexes was visualized by FACS utilizing anti-PC mAb plus a fluorescein isothiocyanate–labeled secondary Ab (KIR) as well as a biotinylated anti-HA mAb plus allophycocyanin-labeled streptavidin (DAP12). Surface expression was compared between KIR-WT (left panels) and KIR-pVal (right panels) transfectants stained with isotype control antibodies (upper panels) and HA and PC tag antibodies (lower panels). A larger percentage of cells transfected with KIR-pVal and DAP12 (14.6%) were double-labeled compared to cells transfected with KIR-WT and DAP12 (9.1%). The images shown are representative of four experiments.
(B–D) Assembly of KIR-pVal with DAP12 in cells. COS cells transiently transfected with KIR and DAP12 constructs were metabolically labeled and complexes were isolated by two-step snIP targeting KIR-PC and DAP12-HA. (B) Cells were labeled for 30 min and analyzed by PC to HA snIP (lanes 1 and 3) after 3-h chase. In control lanes, the PC mAb was replaced with an isotype control (lanes 2 and 4). (C and D) For comparison of the half-life of complexes formed by KIR-WT or KIR-pVal, cells were again labeled for 30 min, then washed and cultured for 0–24 h. KIR–DAP12 complexes were quantitated following two-step snIP and SDS-PAGE under nonreducing conditions. Quantification is presented for the gels shown as well as the average of two independent experiments.

