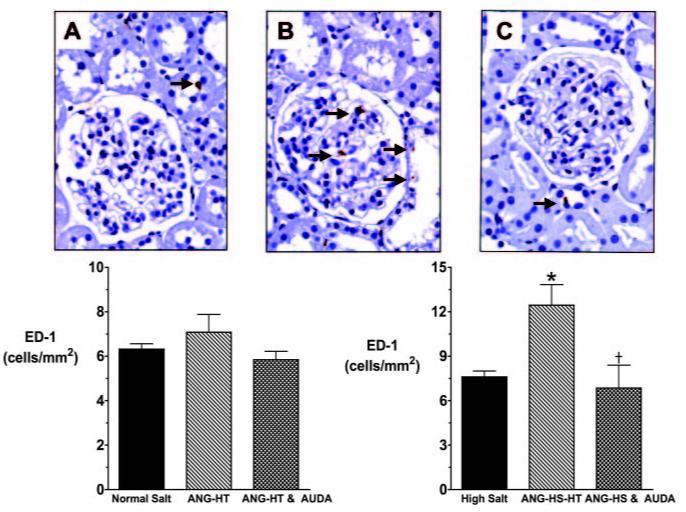
Figure 6.
Comparison of ED-1-positive cell numbers in the kidney glomeruli sections from angiotensin-infused rats fed a high-salt diet (ANG-HS-HT). A, High-salt rat; B, ANG-HS-HT rat; and C, ANG-HT and AUDA-treated rat. Black arrows indicate ED-1-positive cells identified by a blinded observer. The area of kidney represented in each panel is 127 μm2. Bottom graphs depict ED-1-positive cells per area. *Significant difference between the high-salt group and the ANG-HS-HT group; †significant difference between ANG-HS-HT and ANG-HS-HT & AUDA-treated group. Other abbreviations are as defined in text.

