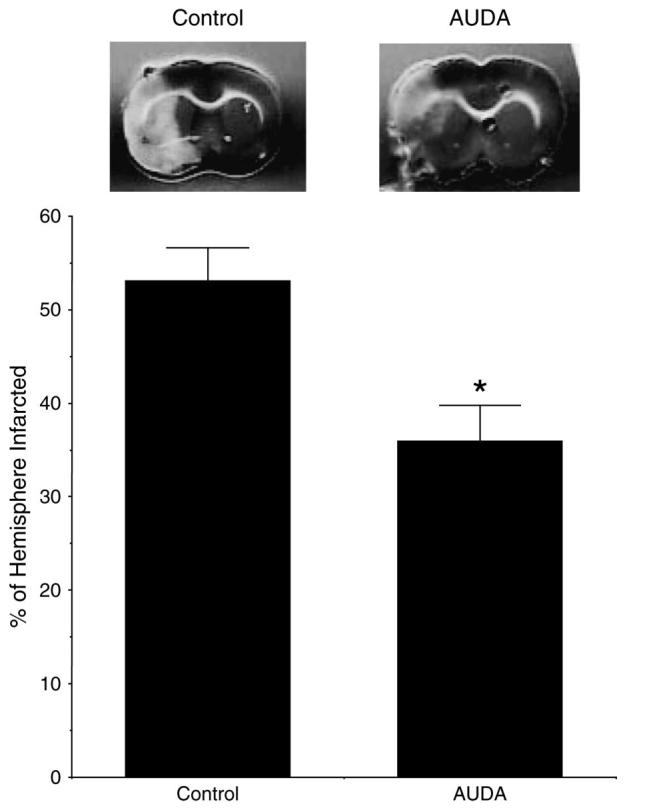
FIGURE 2.

The upper panel shows representative cerebral infarcts for AUDA-treated and control rats; the gray area is viable tissue; and the white area is tissue damaged by ischemia. The lower panel shows the percentage of the hemisphere infarcted (n = 6 in each group *P < 0.05).
