
FIGURE 5.
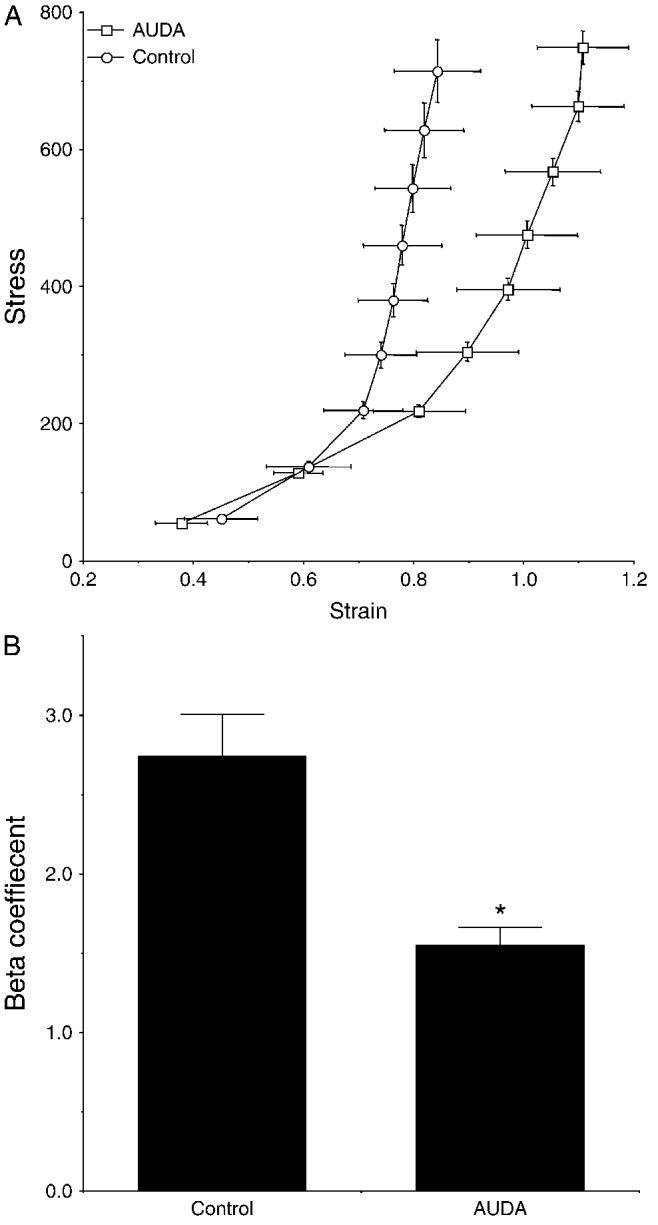
A, Average stress-strain curves generated for the MCAs from AUDA-treated and control SHRSP (n = 8). B, β-Coefficients calculated from the individual stress-strain curves for the MCAs from AUDA-treated and control SHRSP.
Official websites use .gov
A
.gov website belongs to an official
government organization in the United States.
Secure .gov websites use HTTPS
A lock (
) or https:// means you've safely
connected to the .gov website. Share sensitive
information only on official, secure websites.
A, Average stress-strain curves generated for the MCAs from AUDA-treated and control SHRSP (n = 8). B, β-Coefficients calculated from the individual stress-strain curves for the MCAs from AUDA-treated and control SHRSP.