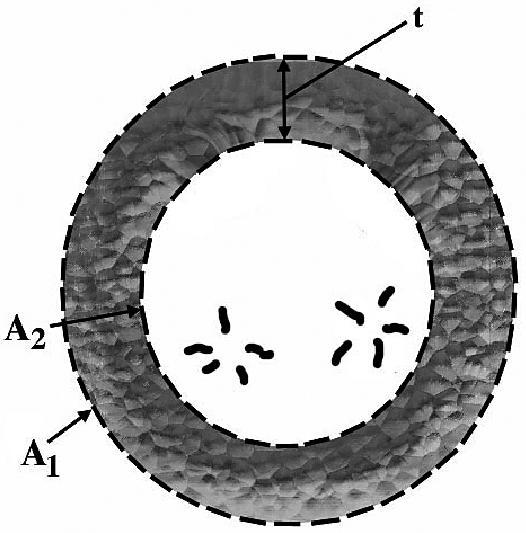
Figure 1.

Schematic illustration of a left ventricular cross section (short axis) at the level of the chordea tendinae. A1: area of the left ventricular epicardial cross section; A2: Area of the left ventricular endocardial cross section; t: Thickness of the myocardial cross section.
