
Figure 1.
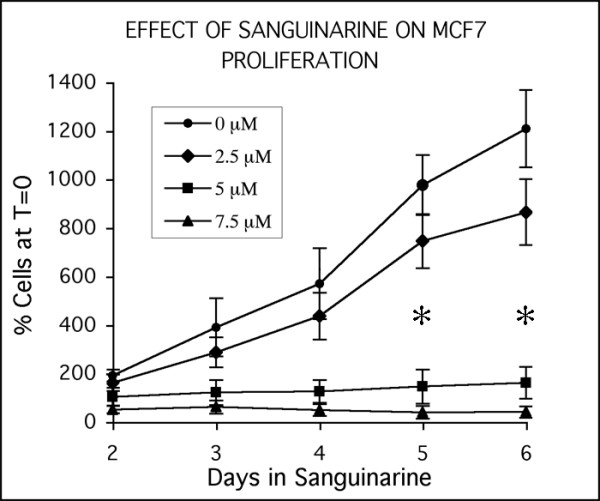
Dose-response characteristics of MCF-7 cells treated with sanguinarine. Responses of cells to a single dose of sanguinarine, showing effective suppression of cell growth in cultures receiving 5 or 7.5 μM sanguinarine. Data points are expressed as percentages of the cell density at time of sanguinarine addition (set at 100%, and called T = 0). Each data point is the average of three independent experiments; bars indicate standard error. Cultures treated with 5 and 7.5 μM sanguinarine for 5 and 6 days contain significantly fewer cells from control cultures and cultures treated with 2.5 μM sanguinarine (asterisks; Student's t-test, p < 0.05).