
Figure 4.
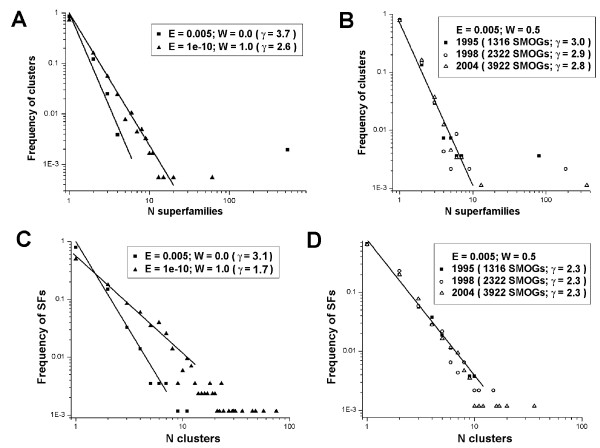
Distributions of number of superfamilies in a SMOG cluster and of number of clusters with a given superfamily. Distributions of number of superfamilies in a SMOG cluster (fm) shown as log-log plots, for various linkage stringencies (A) and for different sizes of the population of solved SMOGs over the years (B). Distributions of number of clusters with a given superfamily assigned (gn), for various linkage stringencies (C) and for different sizes of the population of solved SMOGs over the years (D). To illustrate the sharpness of the distributions, power-law approximations of the continuous parts are shown as lines, with their exponents (γ) indicated in graph legends. In B and D, the lines for different years are very close, and only a single approximation is shown, for the most recent population of solved SMOGs. See text for details.