Figure 5.
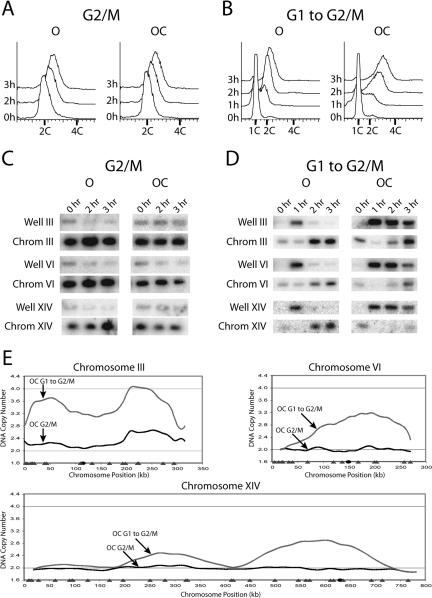
Re-replication can be induced when only ORC and Cdc6 are deregulated. (A) Re-replication is undetectable by flow cytometry in OC cells in G2/M phase. The OC strain YJL3240 (orc2-cdk6A orc6-cdk4A pGAL1-Δntcdc6 pMET3-HA3-CDC20) and the control O strain YJL4832 (orc2-cdk6A orc6-cdk4A pGAL1 pMET3-HA3-CDC20) were arrested in G2/M phase and induced with galactose as described in Figure 2A. Samples for flow cytometry were taken at the indicated times after galactose addition. The OC G2/M re-replication profile in E was normalized to the 3 h DNA content of 2.0 C. (B) Significant re-replication can be induced in OC cells during a G1 release. The OC strain and the control O strain were induced with galactose and released from a G1 arrest as described in Figure 4A. Samples for flow cytometry were taken at the indicated times after G1 release. The OC G1 release re-replication profile in E was normalized to the 3 h DNA content of 2.6 C. (C) Re-replication is not readily detected by PFGE in OC cells in G2/M phase. Strains that were induced to re-replicate in A were harvested for PFGE at the indicated times. Southern blots of the gel were probed for chromosomes III, VI, and XIV as described in Figure 2C. (D) Some but not all copies of each chromosome participate when OC cells are induced to re-replicate in G2/M phase. Strains that were induced to re-replicate in B were harvested for PFGE at the indicated times. Southern blots of the gel were probed for chromosomes III, VI, and XIV as described in Figure 2C. (E) Cell cycle position significantly affects the extent of re-replication in the OC strain. The OC strain and the control O strain were induced to re-replicate in G2/M phase or during a G1 release as described, respectively, in A and B. For each induction protocol, OC and O strain genomic DNA were prepared and competitively hybridized against each other. Shown for chromosomes III, VI, and XIV are OC G2/M phase re-replication profiles (black lines), OC G1 release re-replication profiles (gray lines), locations of pro-ARSs mapped by Wyrick et al. (2001) (gray triangles), and the centromeres (black circles).

