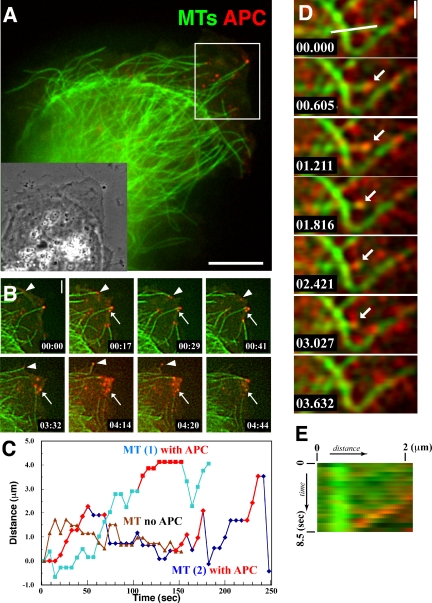
Figure 2.
APC associates transiently with MT ends during all phases of dynamic instability. MTs (green) and endogenous APC (red) were visualized by microinjecting Alexa Fluor 488-tubulin and Alexa Fluor 568-anti-N-APC mAb together into MDCK cells, pairs of images of the two probes were captured over time, and the image pairs were color encoded and overlaid. (A) Spinning disk confocal image from the first frame of Movie 3; the inset shows the phase contrast picture of the same cell. Note that only a small subset of MTs concentrated near the leading edge have an APC cluster at their plus end. Bar, 8 μm. (B) Image series from the region delineated by the white box in A (Movie 4). APC clusters remain associated with growing MT plus ends, and the APC dissociates when the MT switches to shortening (arrowheads). APC clusters also remain stable in the cell protrusion in the absence of association with MT plus ends (small arrows). Bar, 2 μm. (C) Typical MT “life history plots” of the position of different MT plus ends in the same cell over time with and without bound APC. Time during APC-MT association is indicated by red symbols. (D) Total internal reflection fluorescence microscopy image series taken with a high-speed intensified CCD camera reveal the association of an APC cluster that remains associated with a shortening MT plus end (arrow). Also see Movie 5. Bar, 1 μm. (E) Dual-color kymograph of the region highlighted by a white line in D, showing the association of APC with a shortening MT over time.

