Figure 3.
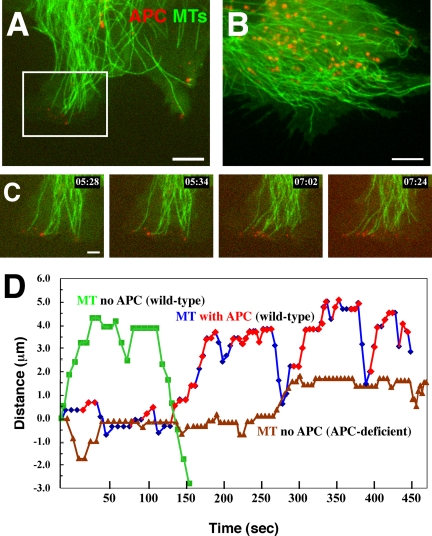
MTs (green) and Ax568-N-APC (red) in 341 (wild type; A) and 335 (APC deficient; B) mouse primary fibroblasts (Movies 6 and 7, respectively). Note that APC signal is neither detected at MT ends nor in peripheral clusters in the APC deficient cells in B. Red granule-like puncta in the cell center are likely nonspecific accumulation of the labeled mAb in lysosomes and can sometimes also be seen in MDCK cells in Figure 2A. Bars in A and B, 5 μm. (C) Magnified image sequence from the region delineated by the white box in A showing the association of APC on dynamic MT ends. Bar, 2 μm. (D) Typical life history plot of APC-decorated MTs (blue) versus non-APC-decorated MTs in wild-type (green) and APC-deficient (brown) cells. Time during APC-MT association marked by red symbols.

