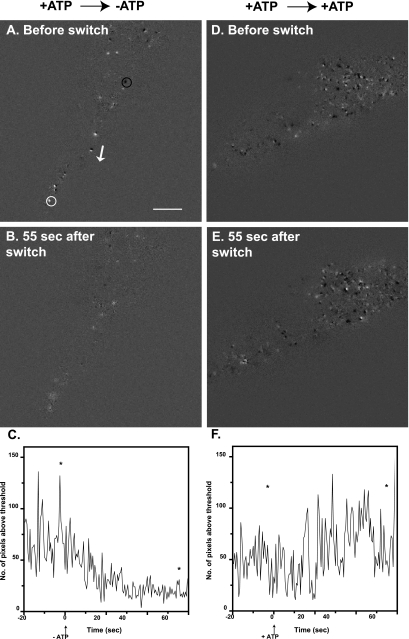
Figure 2.
Difference-image analysis of granule movement before and after removal of ATP. Chromaffin cells were labeled with transiently expressed ANP-GFP, which targets to the secretory granule. Cells were visualized by TIRFM and followed for 20 s before being permeabilized for 30 s with 20 μM digitonin in NaGEP buffer containing 2 mM MgATP, incubated for an additional 60 s in the continuing presence of MgATP, and finally incubated for 60 s in the absence (A-C) or presence (D-F) of MgATP. These movies were subjected to difference-image analysis. Each image was subtracted from the subsequent image on a pixel by pixel basis. A dark spot indicates a negative change (i.e., the disappearance of a granule), an example of which is circled in black in A. A bright white spot (white circle in A) indicates a positive change. A black/white pair (adjacent to white arrow, A) indicates a granule moving laterally, in the direction of black to white (direction indicated by white arrow). (C and F) For each difference-image, the number of pixels above a threshold (or below a negative threshold) was counted. Threshold values were large enough to exclude pixel differences that were in the background, but not so large as to exclude all pixels in the light or dark spots. Asterisks in C and F mark the location of the individual difference-images shown in A and B and D and E, respectively. Bar, 5 μm.

