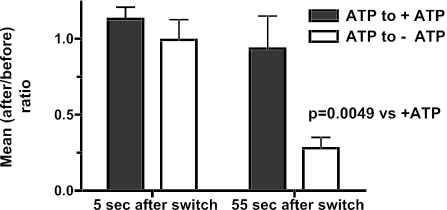
Figure 3.
Summary of difference-image analysis. The number of pixels above a threshold (or below a negative threshold) was counted and averaged over three eight-frame intervals: 4 s before the removal of ATP, 4 s immediately after the switch to -ATP, and eight frames taken 55 s after the switch. For each cell, (after/before) ratios were calculated comparing the mean number of pixels greater than the threshold after the switch (either 5 or 55 s) to the mean number of pixels greater than the threshold before the switch. Thus each cell served as its own control. Student's t test was performed on the logarithms of the ratios (n = 6 cells/group). The logarithms were used (rather than the ratios themselves) since the ratio is an intrinsically asymmetrical measure and the logarithmic transformation is approximately Gaussian.

