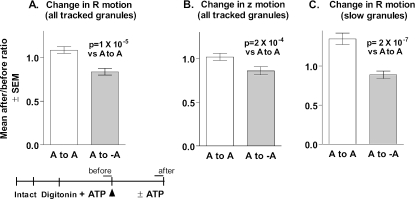
Figure 4.
Tracking granule motions before and after removal of ATP. The movements of individual granules in the cells from Figure 3 were tracked for twenty frames (2 Hz) before and after the removal of MgATP, and ratios [mean motion after/mean motion before] were calculated for each tracked granule. (A) Change in lateral (R) motion for all tracked granules. ATP to ATP, n = 177; ATP to no ATP, n = 114. (B) Change in z motion for all tracked granules. (C) Change in R motion for granules with mean ΔRbefore < 10 nm. ATP to ATP, n = 72; ATP to no ATP, n = 69.

