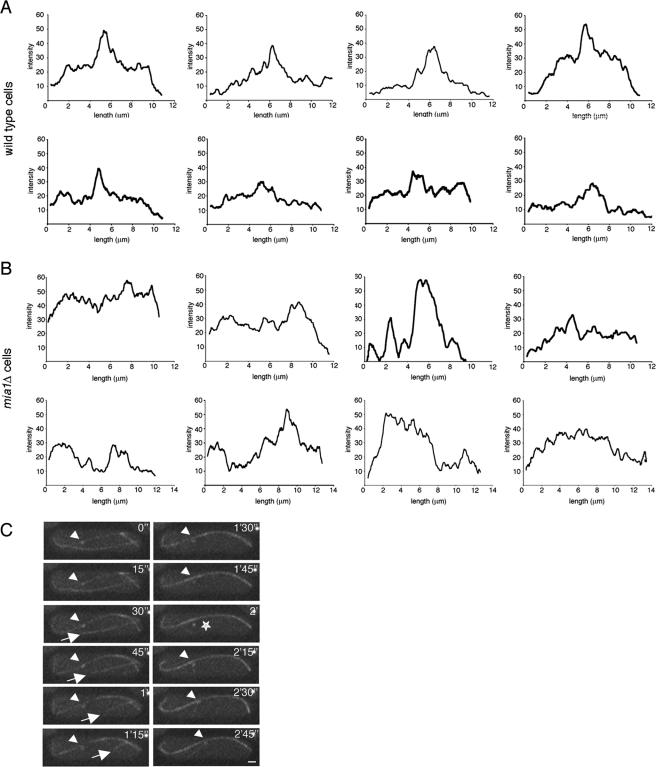
Figure 2.
mia1Δ cells have disorganized and heterogeneous microtubule bundles. (A) Intensity scans of individual microtubule bundles in eight wild-type cells. (B) Intensity scans of individual microtubule bundles in eight mia1Δ cells. Note that although there are distinct medial regions of microtubule overlap in wild-type cells (A), mia1Δ cells (B) show heterogeneous patterns of microtubule arrangements. (C) Time-lapse sequence α-tubulin-GFP– and Sid2p-GFP–expressing mia1Δ cell shows presence of free microtubules undergoing catastrophe (indicated by an arrow) and instances of the SPB detachment from microtubule bundles (indicated by a star). The SPB in the sequence is indicated by an arrowhead. Shown are single maximum intensity reconstructions of z-stacks. Numbers refer to the time, in minutes and seconds. Bar, 1 μm.

