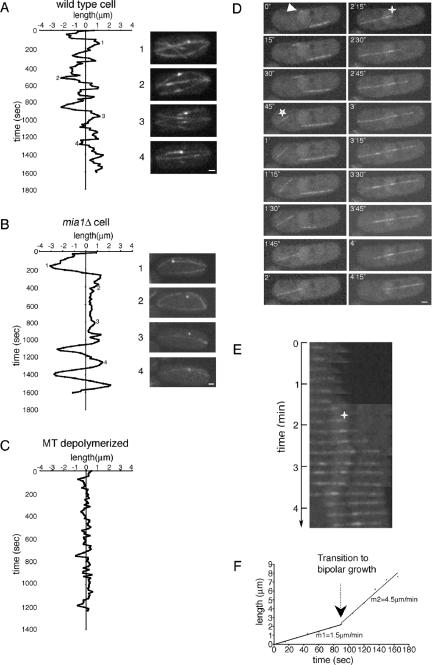
Figure 3.
Mia1p is required for attachment of microtubules to the SPBs and the NE. (A) Plot of SPB oscillations in α-tubulin-GFP Sid2p-GFP–expressing wild-type cell. Some extreme positions of the SPB (indicated as 1–4) are shown on the right of the graph. (B) Plot of SPB movements in α-tubulin-GFP– and Sid2p-GFP–expressing mia1Δ cell. Note that the SPB detached in the course of an experiment (compare positions 2 and 3 with 1 and 4). (C) In MBC-treated wild-type cell, the SPB remained stationary. Shown are single maximum intensity reconstructions of z-stacks. (D) Time-lapse sequence of α-tubulin-GFP–expressing mia1Δ cell. A microtubule nucleation event (indicated by an arrowhead) is followed by microtubule ejection from the NE (indicated by a star). Shown are single maximum intensity reconstructions of z-stacks. Numbers refer to the time, in minutes and seconds, elapsed from the nucleation event. (E) Kymograph of the growing microtubule from the time-lapse sequence presented in D. Time 0 corresponds to the time of microtubule ejection from the NE (marked by a star). Note that microtubule first grew at the plus end facing the cell tip, pushing its minus end toward the center of the cell. A second nucleation event was followed by formation of the antiparallel bundle (marked by a cross; also see corresponding image in D). The resulting bipolar microtubule bundle continued to grow on both sides until the older bundle underwent catastrophe. (F) Graph of microtubule growth rate obtained from the kymograph.

