FIG. 1.
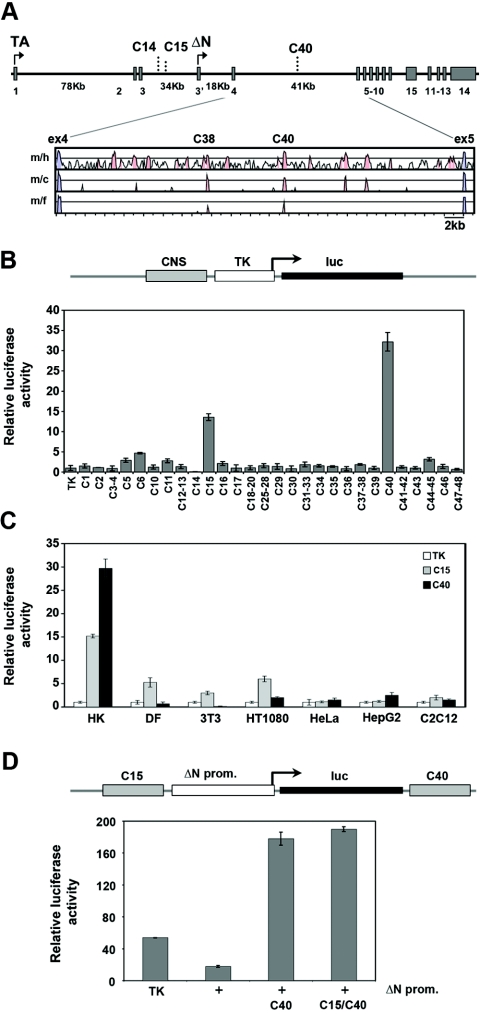
Identification of candidate enhancer regions in the p63 locus. (A) Diagram of the p63 genome organization. Exons and functional noncoding elements (C14, C15, and C40) are indicated. TAp63 transcripts start from exon 1, whereas ΔNp63 transcripts start from the alternative exon 3′ (arrows). The sizes of large introns are indicated in kb. A VISTA plot of the alignment of p63 intron 5 in different species is shown. Exons are indicated in blue, and the conserved noncoding regions are in pink. The mouse genomic sequence (m) was compared to the human (h), chicken (c), and Fugu (f) sequences by MultiLagan and is represented on the x axis. The y axis represents percent identity, with a scale between 50% and 100%. (B) Enhancer/silencer activity of the conserved noncoding elements in the p63 genomic locus. Each conserved noncoding sequence (CNS) was cloned in front of a TK minimal promoter that drives the expression of the luciferase reporter. The transactivation activity of each element was assayed in mouse primary keratinocytes by transient-transfection and luciferase assays. The transfection value of the TK promoter was set at 1. (C) The C15 and C40 enhancers were tested in human primary keratinocytes (HK), mouse dermal fibroblasts (DF), and NIH 3T3, HT1080, HeLa, HepG2, and C2C12 cells. (D) The activity of the ΔNp63 promoter (2.2 kb upstream of the start codon; +) was tested in mouse primary keratinocytes in the presence or in the absence of the C40 element alone or the C40 and C15 elements and compared with that of the TK minimal promoter (TK). The pGL3 promoterless construct value was set at 1. All transfection data are expressed as relative luciferase activity corrected for transfection efficiency, using the cytomegalovirus-Renilla reporter as the internal control, and are representative of at least three independent experiments.

