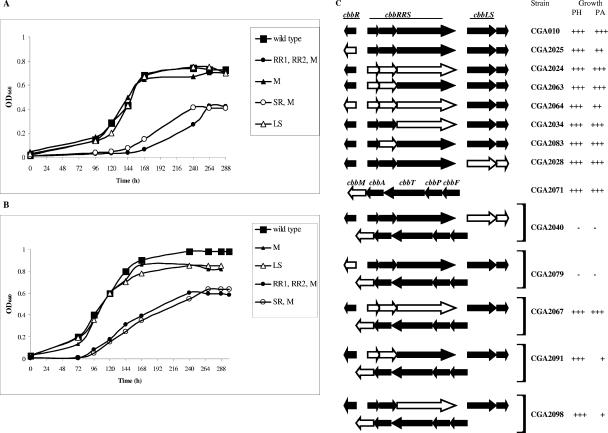
FIG.8.
Representative growth response of some of the most significant strains at 10 mM NaHCO3 (A) or at 25 mM NaHCO3 (B) for the wild-type strain CGA010, strain CGA2028 (ΔcbbLS) (LS), strain CGA2071 (ΔcbbM) (M), strain CGA2091 (ΔcbbRR1 ΔcbbRR2 ΔcbbM) (RR1, RR2, M), and strain CGA2098 (ΔcbbSR, ΔcbbM) (SR, M). (C) Summary of the growth phenotype of the strains generated in this study under photoheterotrophic conditions in the presence of 10 mM sodium succinate (PH), and photolithoautotrophic conditions (PA) in the presence of 10 and 25 mM NaHCO3. Similar cell densities were obtained at low and high concentrations of NaHCO3. The plus symbol indicates the relative density of liquid cultures, grown as in the experiments shown in panels A and B and in the presence of succinate to stationary phase (on average, 288 h for PA growth and 72 h for PH growth). −, lack of PH or PA growth. Open arrow blocks depict the gene or genes deleted.

