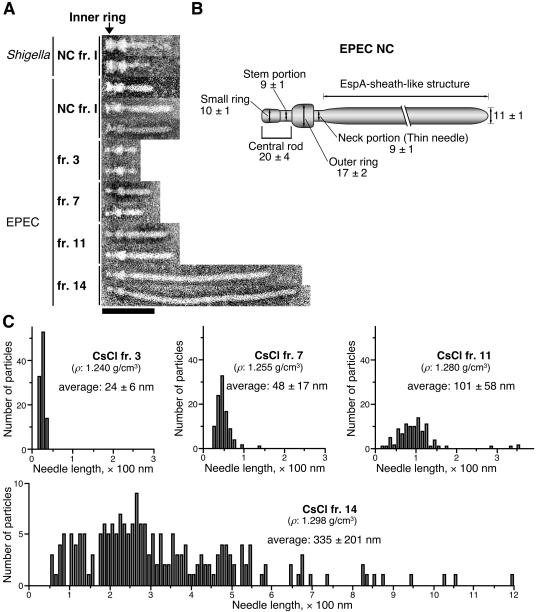
FIG. 3.
Supermolecular structures of the EPEC NCs. (A) Alignment of the EPEC and Shigella NCs detected in NC frs. I and CsCl fractions 3, 7, 11, and 14. Bar, 100 nm. (B) Presumed model of the EPEC NC core structure. The size of each structure is given in nanometers. (C) Distribution of needle length in the NCs, as detected in CsCl fractions 3, 7, 11, and 14. The densities (ρ, g/cm3) of the CsCl fractions are shown in each panel. The average needle lengths were determined by measuring those of 100 (frs. 3, 7, and 11) or 200 (fr. 14) particles. The values represent means ± standard deviations.

