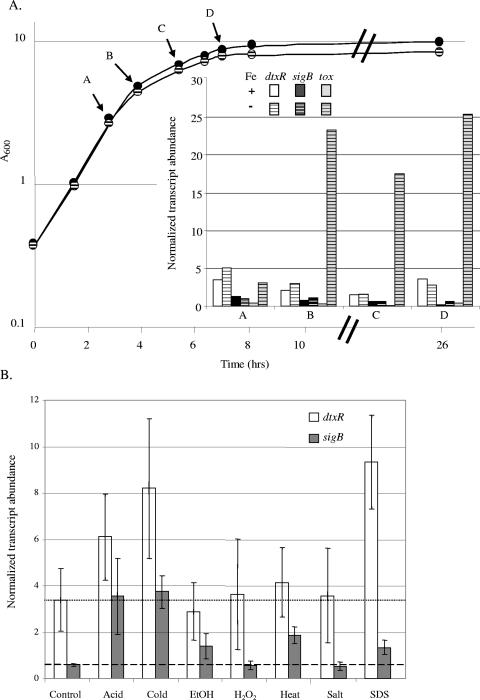
FIG. 7.
(A) The growth curves of C7(β) in PGT (low-iron conditions, striped circles) and PGT plus 10 μM FeCl3 (high-iron conditions, solid circles) media are shown. The abundance of transcripts measured by qRT-PCR with the probes indicated, normalized versus the abundance of sigA transcripts, is shown in the inset graph. The RNA used as a template in the qRT-PCR was isolated from samples of cultures harvested at the time points indicated in the growth curve (A, B, C, and D). Values obtained with RNA from high-iron cultures are shown by the solid bars, and values from low-iron RNA samples are shown by the striped bars. (B) Induction of specific transcripts (defined as normalized transcript abundance under stress conditions/normalized transcript abundance under control conditions) after exposure of C7(β) to indicated stress conditions is shown in the graph. The mean levels of sigB transcripts and dtxR transcripts under the low-iron control conditions are indicated by the dashed and dotted horizontal lines, respectively. The standard deviations between the values for three independent cultures are shown by the error bars. EtOH, ethanol.

