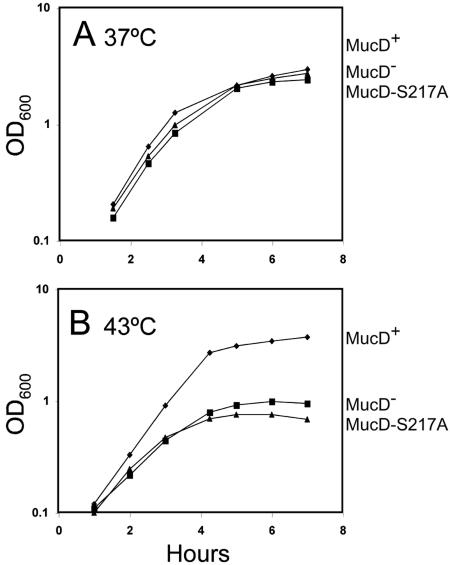
FIG. 5.
Comparison of the growth of PAO isogenic strains at 37°C (A) or 43°C (B) expressing single-copy mucD+, ΔmucD, or mucD217 alleles. Growth was monitored by OD600, and data shown are representative of three comparable experiments. Symbols indicate the following strains: ⧫, PAO1 mucD+; ▪, PDO350 ΔmucD; and ▴, PDO354 mucD217.

