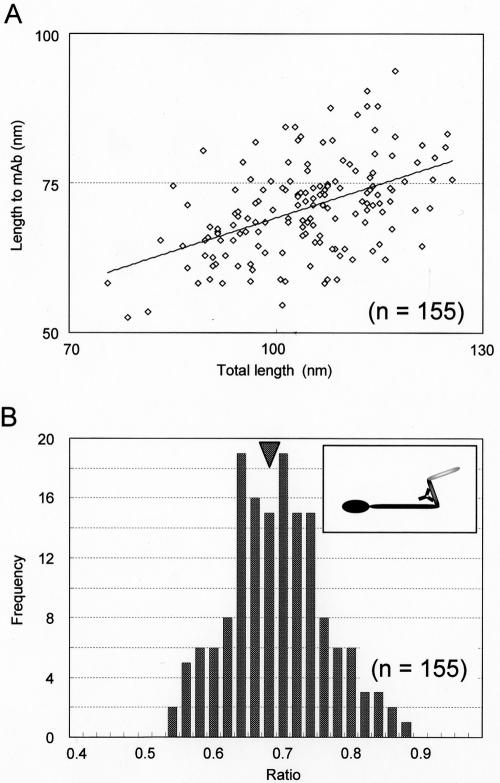
FIG. 7.
Positions of MAb7 on molecular images of Gli349. (A) Relationship between positions of MAb7 on Gli349 images and total length. The solid line shows a linearized approximation. (B) Distribution of MAb7 positions on Gli349 images. The central positions of MAb7 are presented as a ratios of the total length of the molecule. The average was 0.682 (n = 155), as indicated by the arrowhead. The inset shows a schematic illustration of a type I molecule coated with MAb7 at the average position.

