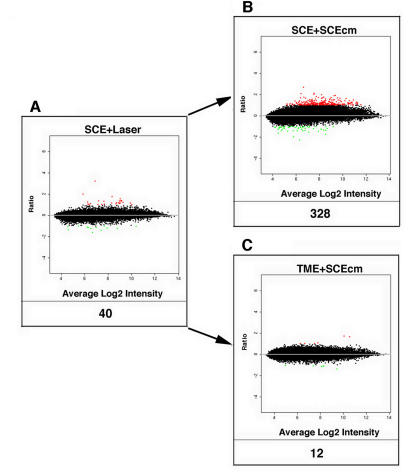
FIGURE 2.
Gene expression in Schlemm’s canal endothelial cells (SCEs). Log-based 2 ratio-intensity scatterplot showing profiles of differentially expressed DE-genes in SCEs after the lasering procedure (A) and by the addition of SCE-cm to naïve SCEs (B) or to naïve trabecular meshwork endothelial cells (TMEs) (C).

