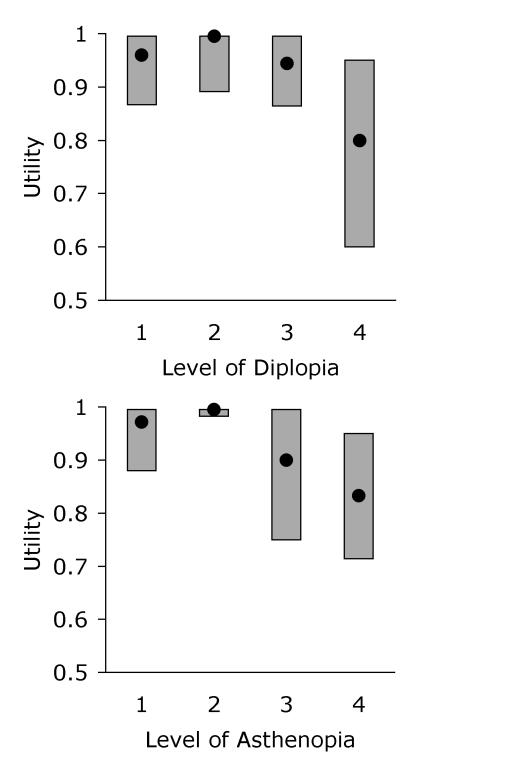
FIGURE 2.
Box plots showing the relationship between time tradeoff utility in adults with strabismus and the physician ratings of each patient’s level of diplopia (top: 1 = None, 2 = In side gaze and/or upgaze only, 3 = In primary gaze and/or downgaze, 4 = Constant) and asthenopia (bottom: 1 = None, 2 = With prolonged effort, 3 = With minimal effort, 4 = Constant). In each box plot, the filled circle corresponds to the median utility, and the box spans the interquartile range (25th percentile to 75th percentile).

